Dashboards
Dashboards are drag-and-drop workspaces where you combine live data, cameras, and controls into one view.
Creating a Dashboard
Section titled “Creating a Dashboard”- Navigate to a connected Relay
- Click the Dashboards tab
- Click Create Dashboard
- Enter a name and optional description
- Optionally add a background image
Every Relay comes with a default dashboard that can’t be deleted.
Widget Types
Section titled “Widget Types”| Widget | What It Shows |
|---|---|
| Symbol Chart | Live PLC data with trend line |
| Camera Feed | Live video from an on-site camera |
| Model Variable | Automation variable over time |
| Model Commands | Buttons to control automations |
| Model Statechart | Live state machine visualization |
| Note | Text labels and instructions |
Adding Widgets
Section titled “Adding Widgets”From the Dashboard
Section titled “From the Dashboard”Click Add Component → choose Symbol, Camera, or Note → configure.
From Other Pages
Section titled “From Other Pages”You can pin charts and controls directly from controller or model pages:
- Click the pin icon on any symbol chart, variable chart, command, or statechart
- Select which dashboard to add it to
Arranging Widgets
Section titled “Arranging Widgets”- Drag to reposition
- Resize from any edge or corner
- Layout saves automatically
Chart Tools
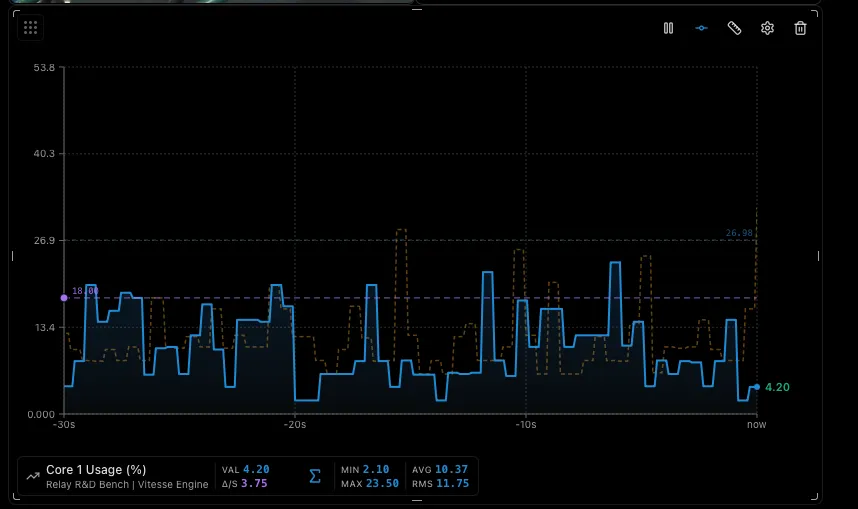
Section titled “Chart Tools”Vitesse charts embed simple yet powerful tools that let you analyze and diagnose your data on the fly - no export, no external software, no context switch.
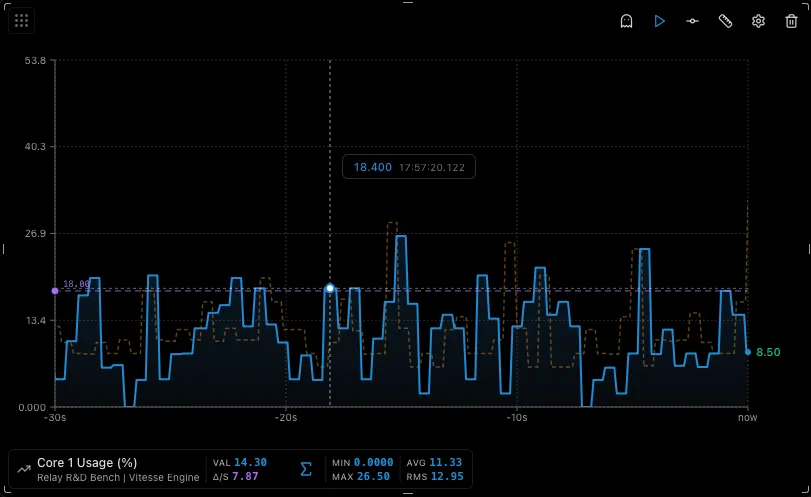
Ghost Overlay
Section titled “Ghost Overlay”Hover over any chart to see the exact value and timestamp.
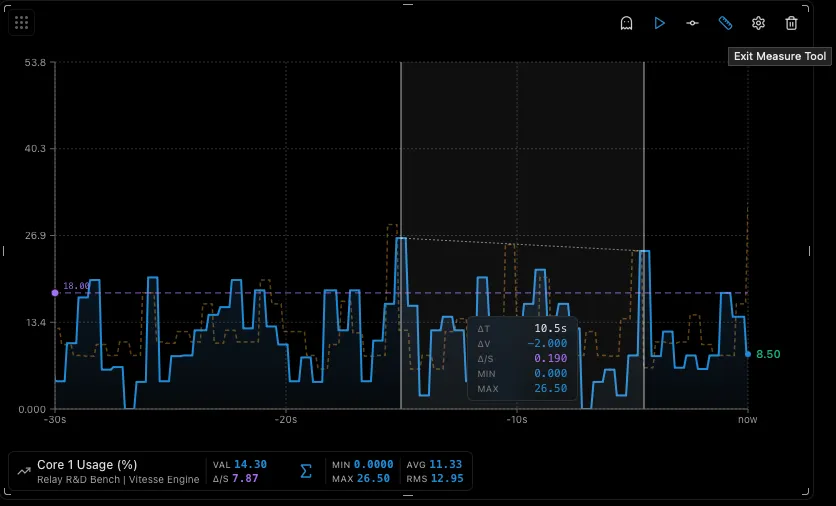
Measure Tool
Section titled “Measure Tool”Click and drag across a chart to select a time range. See ΔT, ΔV, rate of change, MIN, and MAX.
Threshold Lines
Section titled “Threshold Lines”Add visual boundary lines to mark important values (e.g., max safe temperature).